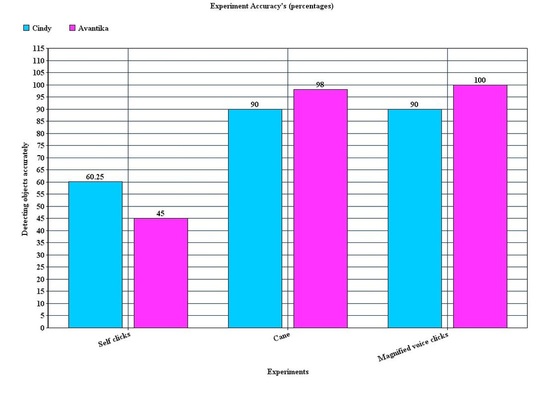
This bar graph represents the percentage of the difference between the estimate and real measurements. In other words, this represents how accurate were at detecting the objects for each experiment. As you can already see, the accuracy for Avantika’s test was 100%for the magnified voice clicks, which means that during the experiment, her estimate was exactly the real measurement. The cause of that will raise the bar for magnified voice clicks in the next graph.
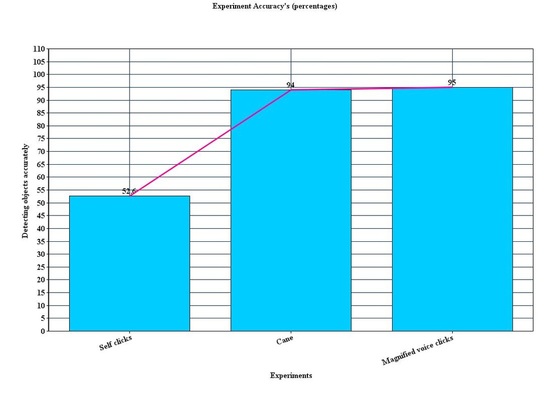
This is a bar graph showing the average accuracy of each method we used. This displays the same information as the previous graph, but is displayed with a bar graph. This graph once again displays the effectiveness of each method.
